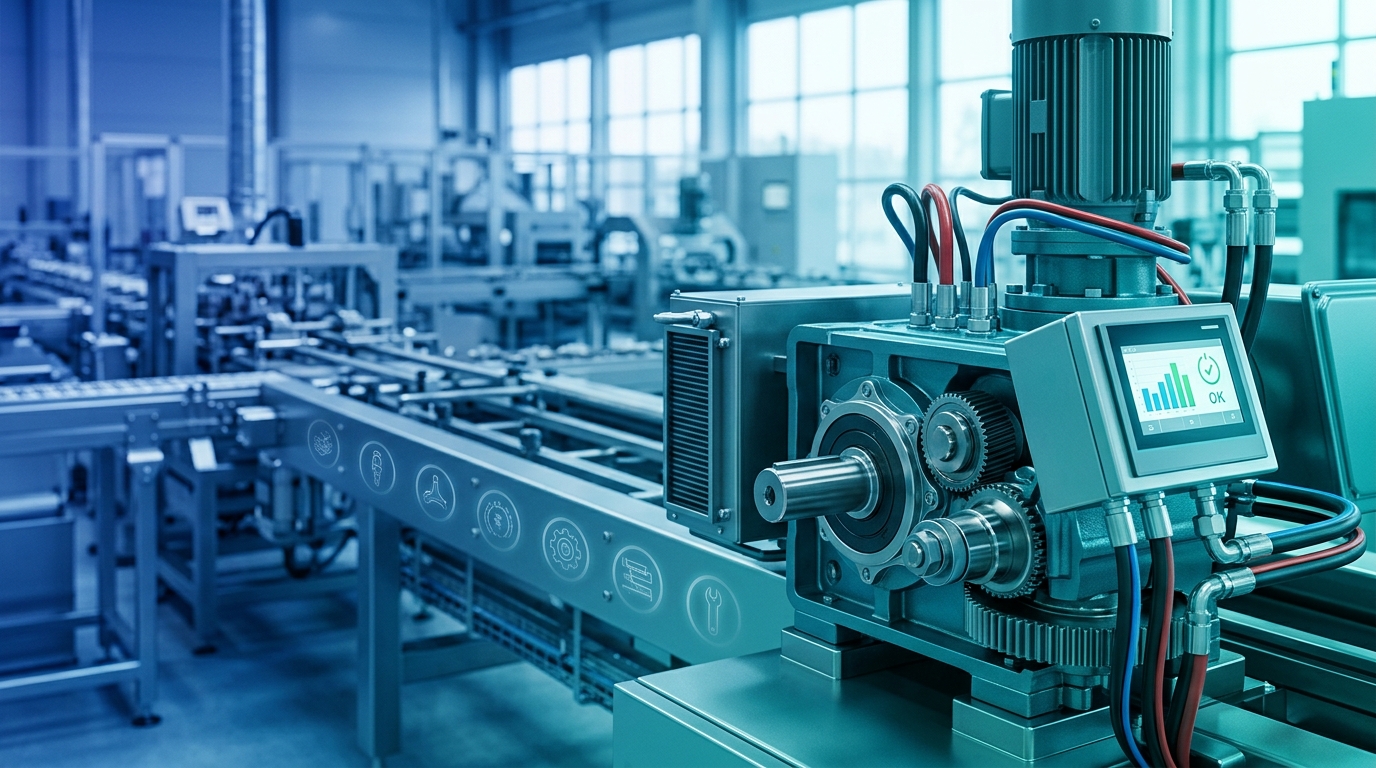
When a packaging line or CNC machining center trips on thermal overload, the standard operational response is predictable: the operator steps aside, logs a maintenance work order, and waits. Half an hour later, a technician arrives, resets the relay, clears a jammed chip conveyor, and returns the machine to service—leaving untouched the fine particulate buildup that caused the heat spike. This rigid boundary between asset operation and asset care drives chronic equipment deterioration, unpredictable micro-stoppages, and reduced plant capacity.
Total Productive Maintenance (TPM) dismantles this functional divide. Developed within Japanese manufacturing (formalized by the Japan Institute of Plant Maintenance), TPM integrates routine equipment maintenance directly into daily production routines, establishing shared ownership over asset reliability.
The Operational Framework: Core Pillars and Paradigm Shift
Traditional manufacturing treats maintenance either as a reactive fire-fighting measure or as an inflexible, calendar-based routine executed strictly by certified craftspeople. Under TPM, asset care becomes continuous, frontline-driven, and integral to standard operations. The target is defined by three absolutes: zero unplanned stops, zero defects, and zero safety incidents.
Figure 1: Eight pillars of productive maintenance
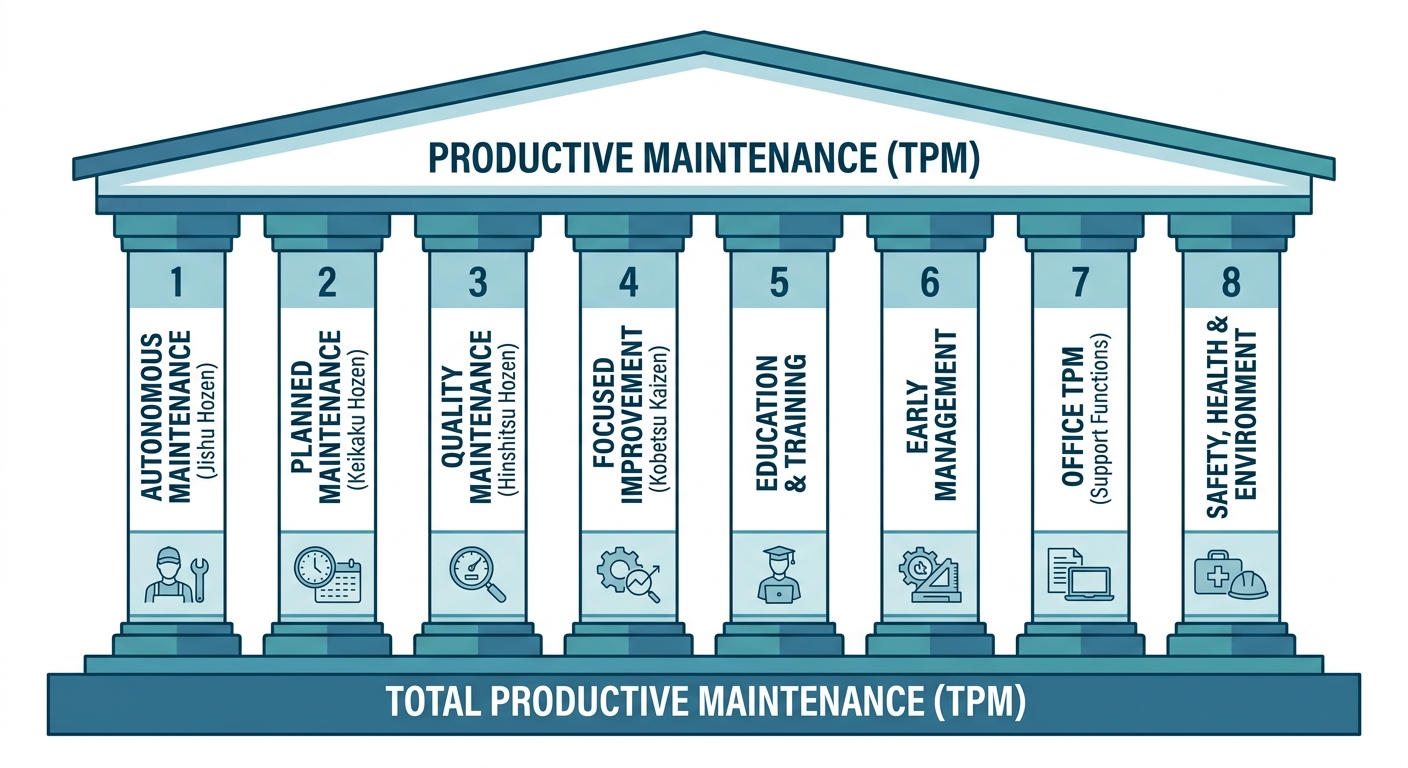
The foundation rests on disciplined 5S execution (Sort, Set in order, Shine, Standardize, Sustain), which stabilizes the physical work environment before deploying the eight functional pillars:
- Autonomous Maintenance (Jishu Hozen): Operators perform routine inspections, cleaning, lubrication, and basic adjustments to catch minor degradation before failure occurs.
- Planned Maintenance: Technicians shift from reactive patching to condition-based monitoring, predictive diagnostics, and disciplined preventive rebuilds.
- Focused Improvement (Kobetsu Kaizen): Cross-functional teams apply root-cause methodologies (e.g., 5-Why, Ishikawa diagrams) to eliminate recurring micro-stops and chronic equipment losses.
- Quality Maintenance (Hinshitsu Hozen): Engineers establish machine tolerances and operating conditions that prevent component defects from causing product non-conformances.
- Early Equipment Management: Engineering teams feed operational life-cycle data back into asset design to minimize commissioning ramp-up times and optimize maintainability.
- Training and Education: Operators receive technical training in sub-assembly mechanics; technicians advance toward diagnostics, vibration analysis, and precision alignment.
- Safety, Health, and Environment (SHE): Engineering controls eliminate ergonomic and mechanical hazards at the machine interface.
- Office TPM: Support functions streamline procurement, spare parts staging, and work-order dispatch to eliminate shop-floor latency.
| Evaluation Metric | Reactive Maintenance | Traditional Preventive Maintenance (PM) | Autonomous Maintenance (TPM) Model |
|---|---|---|---|
| Primary Responsibility | Maintenance department exclusively | Maintenance technicians via CMMS schedules | Operators handle routine care; technicians handle precision engineering |
| Failure Detection Point | Post-functional failure | Fixed run hours or calendar dates | Incipient stage via daily operator sensory checks |
| Operator Role | Passive machine operator | Bystander during service interventions | First line of defense; inspects, cleans, and lubricates |
| Dominant Loss Profile | Catastrophic failures, long repair windows | High planned downtime, premature parts disposal | Micro-stops, speed reductions, process contamination |
| MTTR and MTBF Impact | High MTTR, erratic MTBF | Moderate MTTR, stabilized MTBF | Minimal MTTR on minor stops, significantly extended MTBF |
Executing Jishu Hozen: The Seven Steps of Frontline Care
Autonomous Maintenance is not simply handing hand tools to line operators. Unstructured operator interventions create safety risks and inconsistent adjustments. Jishu Hozen must proceed through seven structured steps:
Figure 2: Autonomous maintenance progression stages
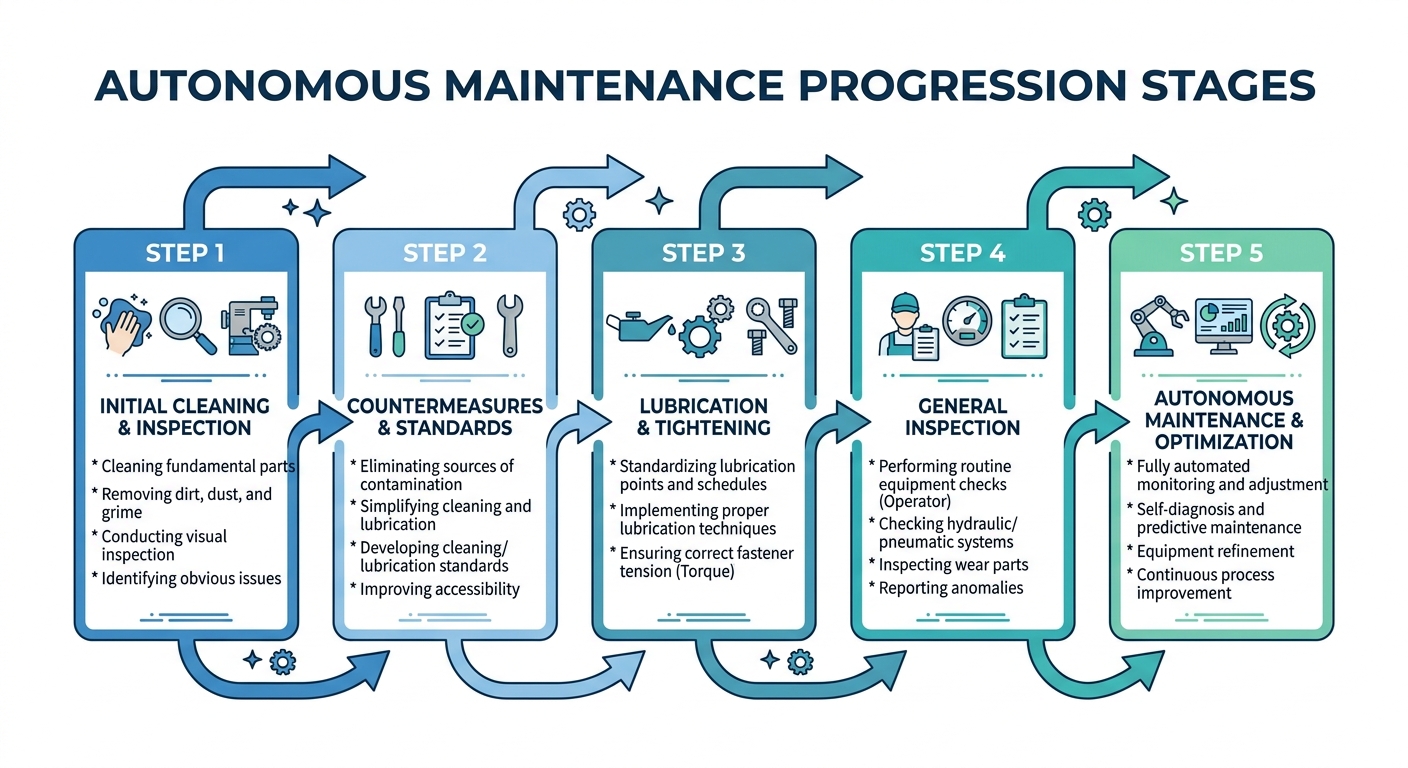
- Step 1: Initial Cleaning and Inspection. Operators clean the equipment down to the base metal. Cleaning serves as an active inspection method to expose hidden defects: loose fasteners, dynamic seal leaks, micro-fractures, and irregular wear profiles.
- Step 2: Countermeasures for Sources of Contamination. The cross-functional team identifies why the asset accumulates dirt, chips, or fluid leaks. Teams install targeted splash guards, redesign vacuum extraction chutes, or seal enclosures to prevent debris from reaching critical wear surfaces.
- Step 3: Establishing Lubrication and Inspection Standards. Operators and maintenance personnel draft Cleaning, Inspection, and Lubrication (CIL) standards. These establish precise lubricant grades, fluid volumes, inspection routes, and time allocations (e.g., five minutes at shift start).
- Step 4: General Inspection Training. Maintenance technicians train operators on basic sub-assemblies: pneumatic regulators, hydraulic loops, drive belts, bearings, and electrical interlocks. Operators learn nominal operating parameters and the physical symptoms of degradation.
- Step 5: Autonomous Inspection. Operators use visual controls—such as color-coded pressure gauges, strobe inspection points, and dynamic level gauges—to execute daily inspection checklists independently.
- Step 6: Workplace Organization and Standardization. Standard Operating Procedures (SOPs) expand to include changeover optimization, point-of-use tooling boards, and localized consumable staging.
- Step 7: Full Autonomous Management. Operators lead daily performance audits, analyze trend lines, and propose engineering modifications directly to plant reliability engineers.
Quantifying Losses: The Six Big Losses and Worked Calculation
TPM targets the elimination of the "Six Big Losses," which roll up into three core performance dimensions:
- Availability Losses: Equipment breakdown/failures and setup/changeover time.
- Performance Losses: Minor idling/stoppages (< 5 minutes) and reduced operating speeds.
- Quality Losses: In-process defects/rework and scrap generated during initial startup.
Figure 3: Six big losses performance framework
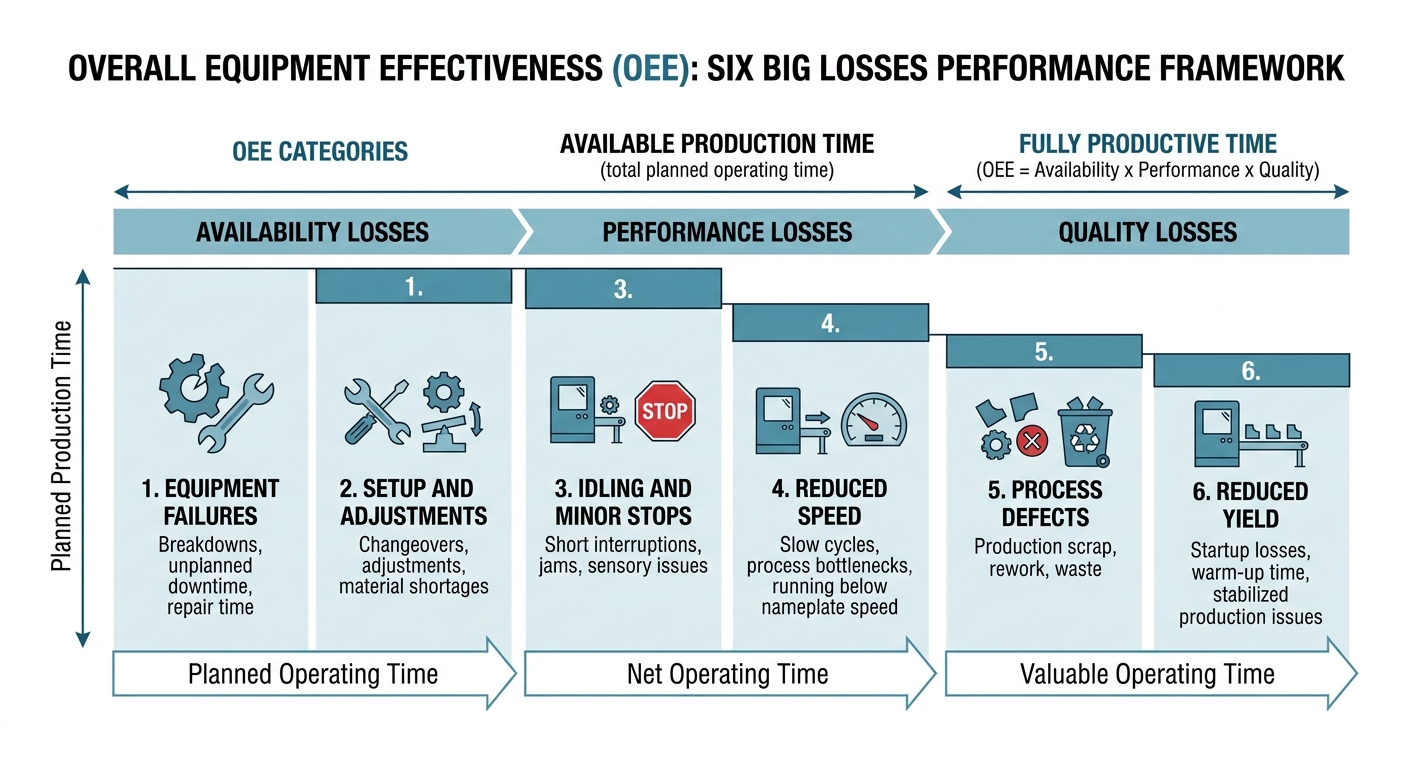
Equipment effectiveness is synthesized into a single composite metric: Overall Equipment Effectiveness (OEE). To model and benchmark these parameters across your production lines, evaluate shift throughput with an OEE Calculator or isolate mechanical reliability using an Availability Calculator.
Worked Engineering Example
Consider an automated bottling and packaging cell evaluated across an 8-hour production shift.
Shift Baseline Parameters:
- Total Shift Duration: \(480\text{ min}\)
- Planned Breaks and Safety Meeting: \(30\text{ min}\)
- Planned Production Time (\(PPT\)): \(480 - 30 = 450\text{ min}\)
- Unplanned Breakdowns: \(38\text{ min}\)
- Tooling Changeover: \(22\text{ min}\)
- Total Downtime: \(38 + 22 = 60\text{ min}\)
- Actual Operating Time (\(OT\)): \(450 - 60 = 390\text{ min}\)
- Ideal Cycle Time (\(ICT\)): \(0.50\text{ seconds/unit} = \frac{0.50}{60}\text{ min/unit} = \frac{1}{120}\text{ min/unit}\)
- Total Units Produced: \(41{,}400\text{ units}\)
- Defective Units (Scrap + Rework): \(1{,}242\text{ units}\)
Step 1: Availability (\(A\))
Availability quantifies the fraction of planned production time the asset actually ran:
$$A = \frac{\text{Operating Time}}{\text{Planned Production Time}} = \frac{390\text{ min}}{450\text{ min}} = 0.8667\text{ (86.67\%) }$$
Step 2: Performance (\(P\))
Performance measures speed degradation and unlogged micro-stops against design capacity:
$$\text{Net Operating Time} = \text{Total Units} \times ICT = 41{,}400 \times \left(\frac{1}{120}\text{ min}\right) = 345\text{ min}$$
$$P = \frac{\text{Net Operating Time}}{\text{Operating Time}} = \frac{345\text{ min}}{390\text{ min}} = 0.8846\text{ (88.46\%) }$$
Step 3: Quality (\(Q\))
Quality evaluates the proportion of saleable, defect-free units relative to total units run:
$$\text{Good Units} = 41{,}400 - 1{,}242 = 40{,}158\text{ units}$$
$$Q = \frac{\text{Good Units}}{\text{Total Units Produced}} = \frac{40{,}158}{41{,}400} = 0.9700\text{ (97.00\%) }$$
Step 4: Overall Equipment Effectiveness (\(OEE\))
The composite metric reflects combined operational performance:
$$OEE = A \times P \times Q = 0.8667 \times 0.8846 \times 0.9700 = 0.7437\text{ (74.37\%) }$$
While the cell achieved an acceptable Quality score (\(97.00\%\)), Availability (\(86.67\%\)) and Performance (\(88.46\%\)) combine to forfeit \(25.63\%\) of theoretical output. Performance loss alone accounts for \(45\text{ min}\) of uncaptured run time (\(390\text{ min} - 345\text{ min}\)), representing intermittent sensor faults, short chokepoints, and operator micro-delays that standard CMMS logs routinely miss.
Sustaining Improvement: Visual Management and Defect Elimination
TPM programs often stall between Step 3 and Step 4 of Jishu Hozen. Initial cleanup efforts drive early enthusiasm, but without active visual controls and rapid work-order execution, contamination returns, checklists become rubber-stamped, and assets regress toward their prior baseline.
Figure 4: Visual controls on critical asset interface
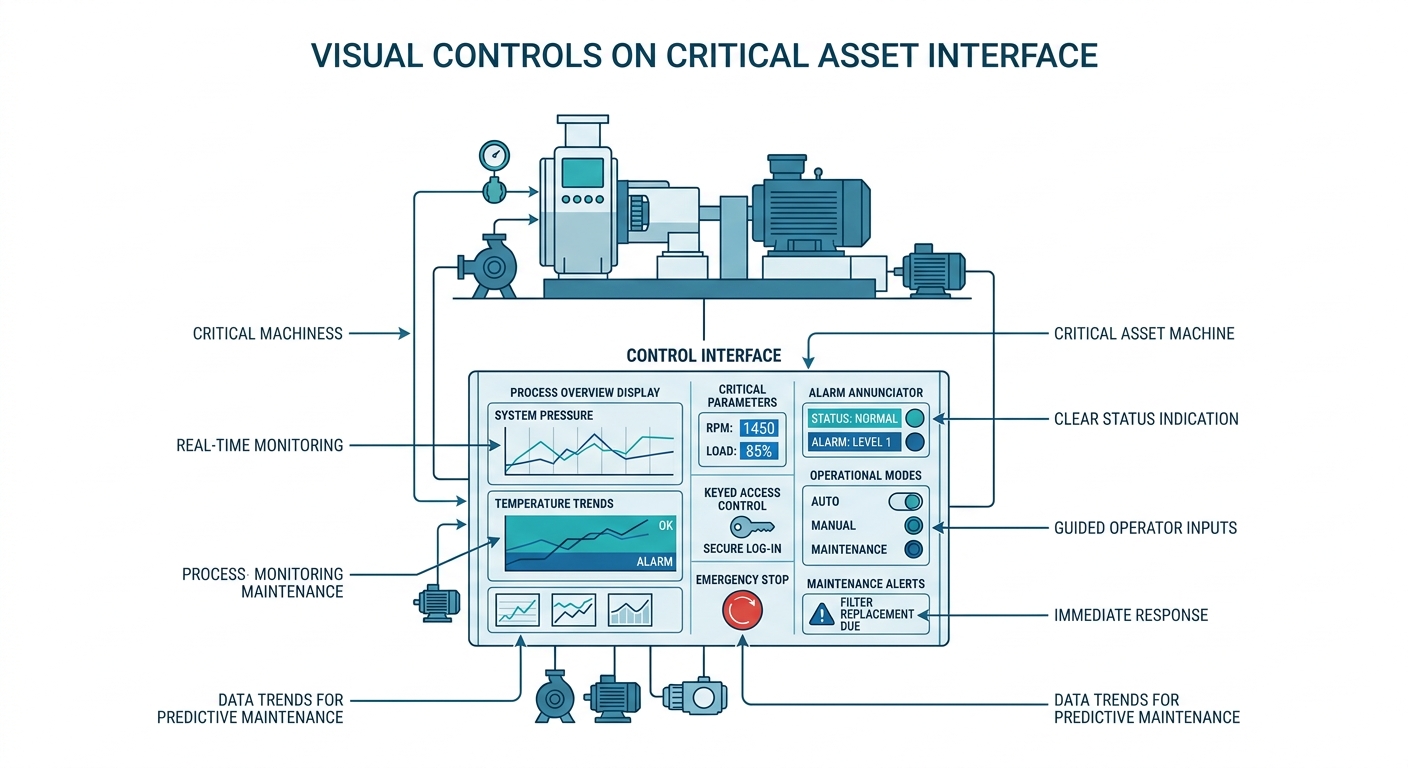
To lock in performance gains, deploy these engineering mechanisms:
- One-Point Lessons (OPLs): Single-topic visual sheets positioned directly at the asset interface. Each OPL illustrates a single standard inspection method, mechanical adjustment, or failure symptom (e.g., verifying correct tension on a timing belt via deflection gauge) that can be read and understood in under five minutes.
- Red-Tagging Protocol: During Step 1 cleaning, operators affix numbered red tags to every discovered defect, fluid weep, or loose bracket. The tag records defect type, date, discoverer, and priority tier. Tags stay attached until a countermeasure is completed, providing a visible audit trail of open mechanical risk.
- Stratified Pareto Prioritization: Rather than addressing every nuisance stop simultaneously, isolate loss categories by stoppage frequency. Tracking downtime distributions with a Pareto Chart Tool identifies the critical \(20\%\) of failure modes that generate \(80\%\) of unplanned line stops.
- Wear-Rate Tracking: As operators establish baseline operating conditions, reliability engineers calculate failure rates on high-stress components using a Failure Rate Calculator to adjust scheduled rebuild intervals prior to functional failure.
Conclusion
Operational reliability is not a service delivered by the maintenance department; it is the cumulative result of daily operating habits, contamination control, lubrication precision, and systematic defect elimination. By grounding the workforce in the eight pillars of TPM, executing structured Jishu Hozen steps, and systematically eliminating the Six Big Losses, plants transition their equipment from chronic sources of instability into predictable, high-yield assets.
Explore ReliabilityCalc.com for interactive engineering calculators, reliability modeling frameworks, and performance tools to accelerate your plant's operational transformation.